Practice Querying the Snowexsql Database
(12 minutes)
Learning Objectives:
First taste of the database!
Code snippets to extract and prep data.
Generate ideas for project pitches.
# standard imports
import numpy as np
import matplotlib.pyplot as plt
import datetime

#database imports
from snowexsql.db import get_db
from snowexsql.data import PointData, LayerData, ImageData, SiteData
from snowexsql.conversions import query_to_geopandas
# load the database
db_name = 'snow:hackweek@db.snowexdata.org/snowex'
engine, session = get_db(db_name)

print('snowexsql database successfully loaded!')
snowexsql database successfully loaded!
Snow Pit data are contained in the following data tables:
PointData = pit ruler depths, SWE.
LayerData = density, temperature, stratigraphy, etc.
SiteData = siteID, airTemp, vegetation, visit time, weather, etc.
Example 1: Let’s find all the pits that overlap with an airborne sensor of interest!
First, it would be helpful to know, which of the airborne sensors are part of the database, right?
# Query the session using .surveyors() to generate a list
qry = session.query(ImageData.surveyors)

# Locate all that are distinct
airborne_sensors_list = session.query(ImageData.surveyors).distinct().all()

print('list of airborne sensors by "surveyor" name: \n', airborne_sensors_list)
list of airborne sensors by "surveyor" name:
 [('USGS',), ('UAVSAR team, JPL',), ('ASO Inc.',)]
1a). Unsure of the flight date, but know which sensor you’d like to overlap with, here’s how:
# Airborne sensor from list above
sensor = 'UAVSAR team, JPL'

# Form on the Images table that returns Raster collection dates
qry = session.query(ImageData.date)

# Filter for UAVSAR data
qry = qry.filter(ImageData.surveyors == sensor)

# Grab the unique dates
qry = qry.distinct()

# Execute the query
dates = qry.all()

# Clean up the dates
dates = [d[0] for d in dates]
dlist = [str(d) for d in dates]
dlist = ", ".join(dlist)
print('%s flight dates are: %s' %(sensor, dlist))

# Find all the snow pits done on these days
qry = session.query(SiteData.geom, SiteData.site_id, SiteData.date)
qry = qry.filter(SiteData.date.in_(dates))

# Return a geopandas df
df = query_to_geopandas(qry, engine)

# View the returned pandas dataframe!
print(df.head())

# Close your session to avoid hanging transactions
session.close()
UAVSAR team, JPL flight dates are: 2020-01-31, 2020-02-12
                             geom site_id        date
0  POINT (740652.000 4327445.000)     2C2  2020-01-31
1  POINT (744396.000 4323540.000)    8C26  2020-01-31
2  POINT (741960.000 4326644.000)    6C10  2020-01-31
3  POINT (741493.000 4326833.000)     1C8  2020-01-31
4  POINT (745340.000 4322754.000)    8S28  2020-01-31
1b). Want to select an exact flight date match? Here’s how:
# Pick a day from the list of dates
dt = dates[0]

# Find all the snow pits done on these days
qry = session.query(SiteData.geom, SiteData.site_id, SiteData.date)
qry = qry.filter(SiteData.date == dt)

# Return a geopandas df
df_exact = query_to_geopandas(qry, engine)

print('%s pits overlap with %s on %s' %(len(df_exact), sensor, dt))

# View snows pits that align with first UAVSAR date
df_exact.head()
17 pits overlap with UAVSAR team, JPL on 2020-01-31
| geom | site_id | date | |
|---|---|---|---|
| 0 | POINT (740652.000 4327445.000) | 2C2 | 2020-01-31 |
| 1 | POINT (744396.000 4323540.000) | 8C26 | 2020-01-31 |
| 2 | POINT (741960.000 4326644.000) | 6C10 | 2020-01-31 |
| 3 | POINT (741493.000 4326833.000) | 1C8 | 2020-01-31 |
| 4 | POINT (745340.000 4322754.000) | 8S28 | 2020-01-31 |
1c). Want to select a range of dates near the flight date? Here’s how:
# Form a date range to query on either side of our chosen day
date_range = [dt + i * datetime.timedelta(days=1) for i in [-1, 0, 1]]

# Find all the snow pits done on these days
qry = session.query(SiteData.geom, SiteData.site_id, SiteData.date)
qry = qry.filter(SiteData.date.in_(date_range))

# Return a geopandas df
df_range = query_to_geopandas(qry, engine)

# Clean up dates (for print statement only)
dlist = [str(d) for d in date_range]
dlist = ", ".join(dlist)

print('%s pits overlap with %s on %s' %(len(df_range), sensor, dlist))

# View snow pits that are +/- 1 day of the first UAVSAR flight date
df_range.sample(10)
47 pits overlap with UAVSAR team, JPL on 2020-01-30, 2020-01-31, 2020-02-01
| geom | site_id | date | |
|---|---|---|---|
| 39 | POINT (743884.000 4324477.000) | 5C21 | 2020-01-30 |
| 40 | POINT (744548.000 4323646.000) | 8C25 | 2020-01-30 |
| 1 | POINT (746228.000 4322671.000) | 9S39 | 2020-02-01 |
| 22 | POINT (740765.000 4327379.000) | 2C3 | 2020-01-31 |
| 38 | POINT (744281.000 4324245.000) | 9N29 | 2020-01-30 |
| 6 | POINT (743652.000 4322680.000) | 3S14 | 2020-02-01 |
| 7 | POINT (747055.000 4323916.000) | 5N50 | 2020-02-01 |
| 45 | POINT (742674.000 4325582.000) | 7C15 | 2020-01-30 |
| 28 | POINT (740839.000 4327345.000) | 2C4 | 2020-01-31 |
| 44 | POINT (745458.000 4322762.000) | 5S31 | 2020-01-30 |
1d). Have a known date that you wish to select data for, here’s how:
# Find all the data that was collected on 2-12-2020
dt = datetime.date(2020, 2, 12)

#--------------- Point Data -----------------------------------
# Grab all Point data instruments from our date
point_instruments = session.query(PointData.instrument).filter(PointData.date == dt).distinct().all()
point_type = session.query(PointData.type).filter(PointData.date == dt).distinct().all()

# Clean up point data (i.e. remove tuple)
point_instruments = [p[0] for p in point_instruments]
point_instruments = ", ".join(point_instruments)
point_type = [p[0] for p in point_type]
point_type = ", ".join(point_type)
print('Point data on %s are: %s, with the following list of parameters: %s' %(str(dt), point_instruments, point_type))

#--------------- Layer Data -----------------------------------
# Grab all Layer data instruments from our date
layer_instruments = session.query(LayerData.instrument).filter(LayerData.date == dt).distinct().all()
layer_type = session.query(LayerData.type).filter(LayerData.date == dt).distinct().all()

# Clean up layer data
layer_instruments = [l[0] for l in layer_instruments if l[0] is not None]
layer_instruments = ", ".join(layer_instruments)
layer_type = [l[0] for l in layer_type]
layer_type = ", ".join(layer_type)
print('\nLayer Data on %s are: %s, with the following list of parameters: %s' %(str(dt), layer_instruments, layer_type))

#--------------- Image Data -----------------------------------
# Grab all Image data instruments from our date
image_instruments = session.query(ImageData.instrument).filter(ImageData.date == dt).distinct().all()
image_type = session.query(ImageData.type).filter(ImageData.date == dt).distinct().all()

# Clean up image data (i.e. remove tuple)
image_instruments = [i[0] for i in image_instruments]
image_instruments = ", ".join(image_instruments)
image_type = [i[0] for i in image_type]
image_type = ", ".join(image_type)
print('\nImage Data on %s are: %s, with the following list of parameters: %s' %(str(dt), image_instruments, image_type))
Point data on 2020-02-12 are: camera, magnaprobe, pit ruler, with the following list of parameters: depth
Layer Data on 2020-02-12 are: IRIS, IS3-SP-11-01F, snowmicropen, with the following list of parameters: density, equivalent_diameter, force, grain_size, grain_type, hand_hardness, lwc_vol, manual_wetness, permittivity, reflectance, sample_signal, specific_surface_area, temperature

Image Data on 2020-02-12 are: UAVSAR, L-band InSAR, with the following list of parameters: insar correlation, insar interferogram real, insar interferogram imaginary, insar amplitude
Nice work, almost done here!
Classify pit data based on the depth and vegetation matrix
Example 2:
2a).Distinguish pits by vegetation coverage:
treeless (0% tree cover)
sparse (1-30% tree cover)
dense (31-100% tree cover)
*vegetation classes assigned based on optical imagery: tree density map, Nov. 2010 WorldView-2 Imagery
def parse_veg_class(site_id):

    '''
    This function parses snow pit data into three vegetation classes:
        - 1). Treeless, 2). Sparce, and 3). Dense

    It uses a python dictionary where:
        (k) keys: are the vegetation classes
        (v) values: are the first digit in the pitID assignment


    '''

    # Classifying by vegetation coverage
    veg_class = {'treeless':[1, 2, 3], 'sparse':[4, 5, 6], 'dense':[7, 8, 9]}

    vclass = None

    class_id = site_id[0]

    if class_id.isnumeric():
        class_id = int(class_id)

        for k,v in veg_class.items():

            if class_id in v: #if the first digit in the site_id is 'v' assign it to the corresponding 'k'
                vclass = k

    return vclass
2b). Distinguish pits by snow depth classes:
shallow (<90cm)
medium (90-122cm)
deep (>122cm)
*depth classes assigned based on 2017 ASO snow depth lidar
def parse_depth_class(site_id):

    '''
    This function parses snow pit data into three depth classes:
        - 1). Shallow, 2). Medium, and 3). Deep

    It uses a python dictionary where:
        (k) keys: are the depth classes
        (v) values: are the first digit in the pitID assignment


    '''

    # Classifying by 2017 depth
    depth_class = {'shallow':[1, 4, 7], 'medium':[2, 5, 8], 'deep':[3, 6, 9]}

    dclass = None

    class_id = site_id[0]

    if class_id.isnumeric(): #for the outlier TS site
        class_id = int(class_id) #cast as integer

        for k,v in depth_class.items(): #for the key, value pairs in the dict listed above:

            if class_id in v: #if the first digit in the site_id is 'v' assign it to the corresponding 'k'
                dclass = k

    return dclass
# Load the database
db_name = 'snow:hackweek@db.snowexdata.org/snowex'
engine, session = get_db(db_name)

# Query for Layer Data
result = session.query(LayerData.type).distinct().all()

# Filter for density data
qry = session.query(LayerData).filter(LayerData.type=='density')

# Form our dataframe from the query
df = query_to_geopandas(qry, engine)
df['value'] = df['value'].astype(float)  #cast the value as a float (they are strings)

# Parse snow pit data by the veg/depth matrix
df['veg_class'] = [parse_veg_class(i) for i in df['site_id']] #run the parse_veg function for every site_id
df['depth_class'] = [parse_depth_class(i) for i in df['site_id']] #run the parse_depth function for every site_id

# Select columns of interest
col_list = ['site_id', 'date', 'type', 'latitude',
       'longitude', 'depth', 'value', 'veg_class', 'depth_class']
df = df[col_list]

# View a sample --> notice parsed veg_class and depth_class columns were added!
df.sample(5)
| site_id | date | type | latitude | longitude | depth | value | veg_class | depth_class | |
|---|---|---|---|---|---|---|---|---|---|
| 535 | 7N40 | 2020-02-04 | density | 39.030700 | -108.163686 | NaN | 251.0 | dense | shallow |
| 1229 | 8N33 | 2020-02-06 | density | 39.030082 | -108.171242 | 43.0 | 293.0 | dense | medium |
| 776 | 9N59 | 2020-01-28 | density | 39.029615 | -108.134045 | 73.0 | 251.5 | dense | deep |
| 899 | FL1B | 2020-02-12 | density | 39.021928 | -108.174165 | 20.0 | 293.5 | None | None |
| 1529 | 6N16 | 2020-02-08 | density | 39.031465 | -108.191573 | 41.0 | 383.0 | sparse | deep |
# Group by site-id to count classes
gb = df.groupby(['site_id', 'veg_class', 'depth_class'])

print(gb['site_id'].count().groupby('veg_class').count())
print('\n')
print(gb['site_id'].count().groupby('depth_class').count())
veg_class
dense       50
sparse      39
treeless    60
Name: site_id, dtype: int64


depth_class
deep       45
medium     78
shallow    26
Name: site_id, dtype: int64
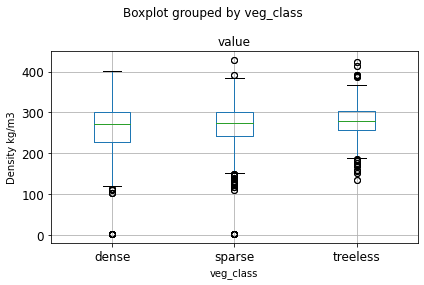
Plot
# boxplot for veg_class
df.boxplot(column='value', by='veg_class', fontsize='large')
plt.ylabel('Density kg/m3')
plt.tight_layout()
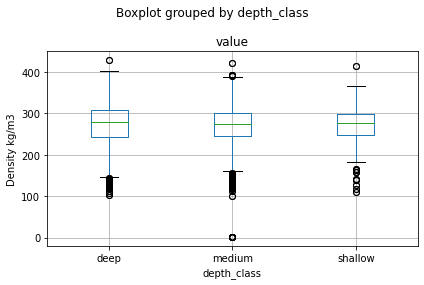
# boxplot for depth_class
df.boxplot(column='value', by='depth_class')
plt.ylabel('Density kg/m3')
plt.tight_layout()
# Great for debugging especially when trying different queries
session.rollback()
# Close your session to avoid hanging transactions
session.close()